
Building Observability for a Production GenAI System: An Internal Knowledge Base End-to-End

This series has covered the three pillars of production GenAI observability - Token Economics, Evaluation, and Latency & Reliability as separate concerns. In practice they’re not separate. They’re instrumented together, they affect each other, and the signals from one pillar frequently explain anomalies in another.
This post puts it all together through a single concrete system: an internal knowledge base Q&A assistant. The kind of system most engineering teams either have already built or are actively building - employees ask questions, the system retrieves relevant documentation and policy content, and an LLM generates a grounded response.
It’s a good vehicle for this because it’s representative. RAG pipeline, multi-turn conversations, mixed query complexity, real users with real stakes, and all three observability pillars in play simultaneously. Everything here applies directly to customer-facing systems, agent pipelines, and more complex architectures - the instrumentation patterns scale up, not just sideways.
The System We’re Instrumenting
Before instrumenting anything, it helps to be precise about what we’re building and where the failure points are.
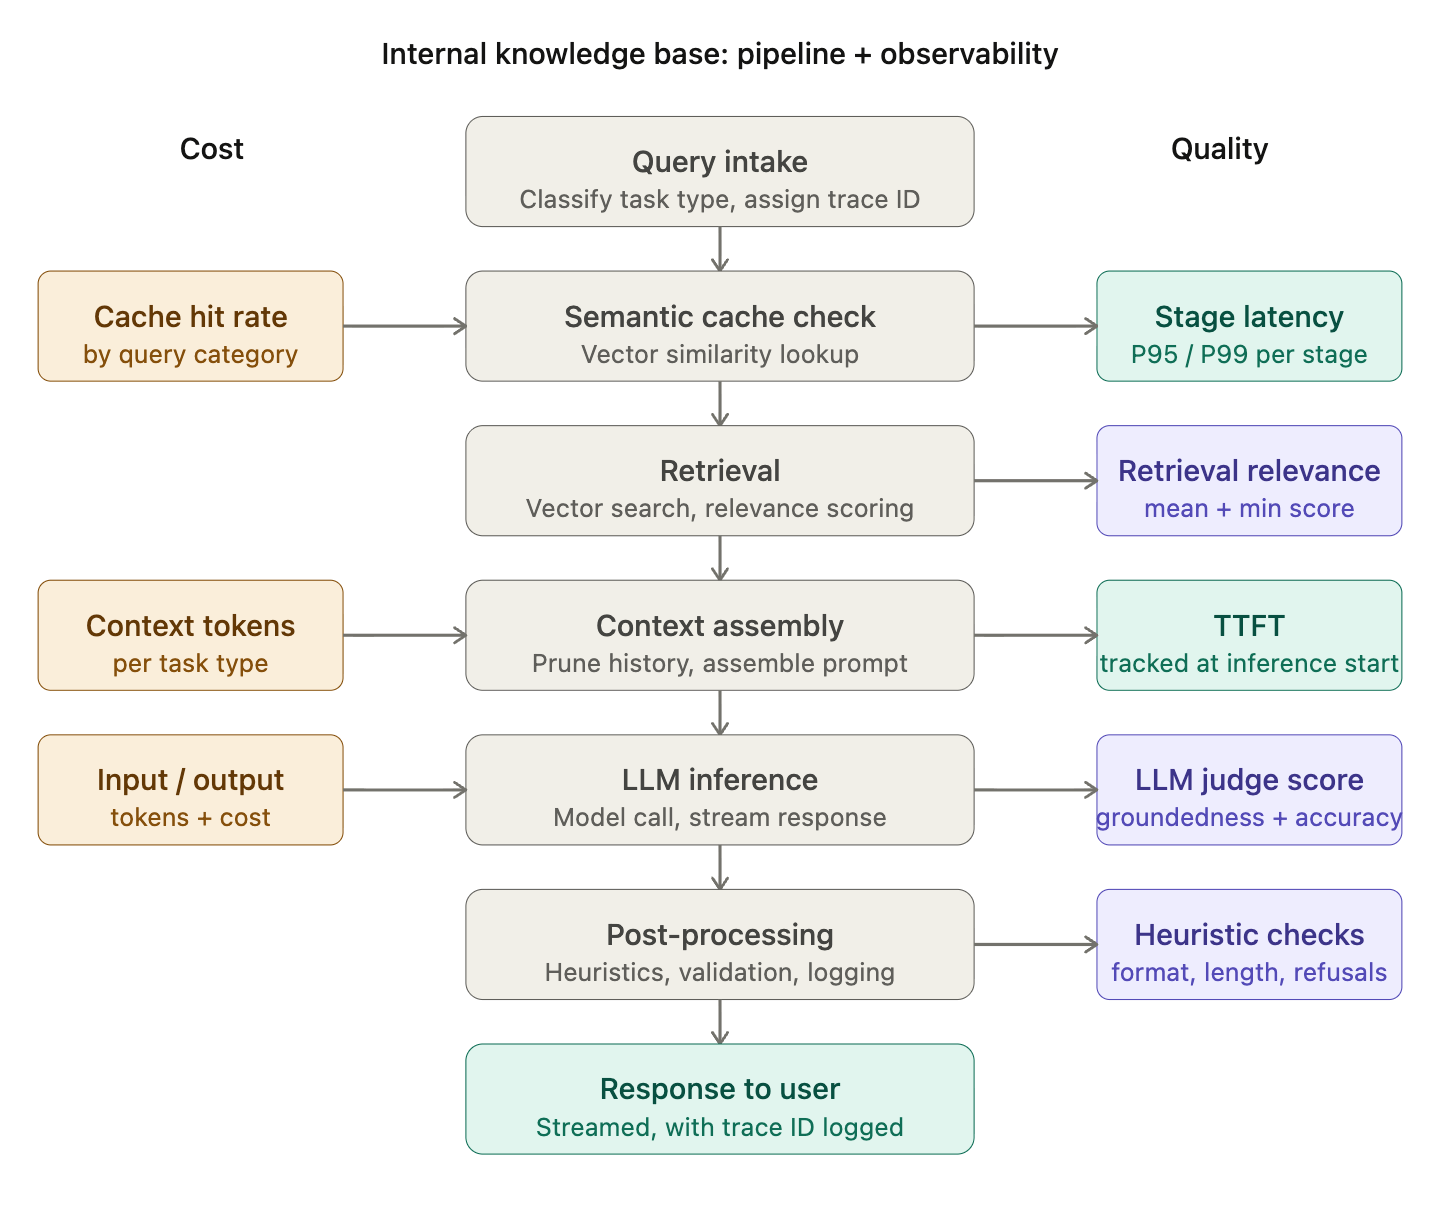
The pipeline:
A user submits a natural language query. The query is preprocessed and classified by task type. Relevant chunks are retrieved from a vector index of internal documentation, policies, and runbooks. Retrieved context is assembled with conversation history into a prompt. The LLM generates a response grounded in retrieved context. The response is post-processed, validated, and streamed back to the user.
The users: employees across engineering, product, HR, finance, and operations - with very different query types, domain expertise levels, and tolerance for incorrect answers.
The stakes: HR policy answers that are wrong erode trust fast. Engineering runbook answers that are wrong cause incidents. Finance procedure answers that are wrong have compliance implications. This isn’t a low-stakes system.
The failure modes:
Retrieval returning outdated or irrelevant documentation
LLM hallucinating details not present in retrieved context
Latency spikes making the system feel unreliable
Token costs compounding as conversation histories grow
Quality degrading silently after a documentation index refresh
Each of these maps directly to one of the three pillars. None of them are visible without deliberate instrumentation.
The Observability Foundation
Before instrumenting individual pillars, two things need to be in place across the entire system.
Trace propagation. Every request needs a unique trace ID assigned at intake and carried through every stage of the pipeline - retrieval, context assembly, inference, post-processing. This is the thread that connects cost attribution, quality scores, and latency measurements back to individual requests. When something goes wrong, you reconstruct the full execution path rather than guessing from aggregate signals.
Structured logging. Every log event should be emitted as structured data - not free-text strings. Free-text logs are readable. Structured logs are queryable. The difference matters when you’re trying to find all requests where retrieval latency exceeded 500ms and quality scores were simultaneously below threshold. Every log event gets the trace ID, a timestamp, an event type, and the relevant metrics for that stage.
With these two in place, every subsequent instrumentation layer has a consistent foundation to build on.
Pillar 1: Cost Observability
An internal knowledge base has a cost profile that’s easy to underestimate. Query volume is moderate but consistent throughout the workday. Conversation histories grow across sessions. Retrieval pulls multiple chunks per query. And the query mix is wide —-a simple policy question costs a fraction of a multi-step procedure walkthrough.
Instrument at every stage, not just inference.
Most cost instrumentation focuses on the LLM call. That’s half the picture. Embedding generation, retrieval, and context assembly all have token footprints, and understanding which stage is driving cost growth requires stage-level attribution. Track input tokens, output tokens, and context assembly tokens separately and tag every cost event with the task type that generated it.
The metric that matters: cost per successful task by task type.
Aggregate monthly spend tells you the bill is high. Cost per successful task by task type tells you which query categories are economically unsustainable and where to focus optimization. It also tells you immediately when a cost optimization has degraded quality - cost per task drops but task success rate drops with it, which isn’t an optimization.
Semantic caching is high-leverage for this system.
Internal knowledge bases have high query repetition - the same HR policy questions, the same onboarding procedure questions, the same engineering setup questions —-asked by different employees throughout the week. A semantic caching layer that returns stored responses for queries above a similarity threshold (typically 0.92-0.95 cosine similarity) can eliminate 30-50% of LLM calls for high-frequency query categories. Track cache hit rate by query category as a first-class operational metric. A declining cache hit rate is often the first signal of query distribution shift.
Context pruning prevents compounding cost.
Without a conversation history limit, context tokens grow with every turn. A five-turn conversation that started with a simple policy question is passing thousands of tokens of history on every subsequent query. Set a rolling window- five turns is a reasonable starting point and summarize older history rather than truncating it. Track average context tokens per request by task type and alert when it starts climbing without a corresponding increase in query complexity.
Cost alerts worth configuring:
Cost per successful task rising more than 20% week-over-week for any task type
Cache hit rate dropping below 25% for high-frequency query categories
Average context tokens per request exceeding a defined threshold by task type
Pillar 2: Quality Observability
Quality failures in an internal knowledge base are particularly consequential. A hallucinated HR policy answer, an outdated engineering procedure, an incorrect finance guideline ,these erode trust in the system fast and are hard to recover from. The primary risk here isn’t low-quality responses. It’s confidently wrong responses that employees act on.
Capture everything at inference time.
The core requirement: log enough context at inference time to evaluate quality later. This means the full assembled prompt, retrieved chunks with their relevance scores, the model output, and any user feedback signals. Without this, you’re evaluating samples in a vacuum. With it, every captured interaction becomes a data point for eval, regression testing, and retrieval quality analysis.
Use tiered logging: full capture for every error and flagged response, sampled capture (15-20%) for normal traffic. The storage cost is manageable; the debugging value is significant.
LLM-as-judge evaluation - decomposed, not holistic.
For this system, the most important quality dimensions are groundedness and accuracy.
Groundedness is every claim in the response supported by the retrieved context? Is the highest-stakes dimension because it’s the primary protection against hallucination.
Accuracy is the information correct based on the context provided?It catches cases where retrieval returned outdated documentation.
Don’t ask the judge for a single overall quality score. Ask separately for groundedness, accuracy, completeness, and clarity. Decomposed scores are more reliable and more actionable when quality drops, you know which dimension changed. Use chain-of-thought prompting before scoring to reduce variance, and use a different model family than your production model to reduce self-preference bias.
Run evaluation asynchronously on sampled live traffic not in the request path. The goal is a quality trend dashboard updated continuously from production data, not real-time per-request scoring.
Heuristics for deterministic checks - synchronous, always running.
Not everything needs a judge model. Format compliance, minimum and maximum response length by task type, uncertainty phrase detection (”I think,” “I believe,” “I’m not sure”), refusal detection, and structural requirements for procedure questions - these should be rule-based, fast, and running on every request. A spike in uncertainty phrases is often the first signal that retrieval is returning weak context. A spike in refusals often indicates a documentation coverage gap.
Audit your heuristics periodically. Rules that haven’t triggered in three months probably don’t belong there.
Retrieval quality is a leading indicator of overall quality.
In a knowledge base system, retrieval is where quality most often breaks down especially after documentation updates. Track mean relevance score and minimum relevance score for retrieved chunks by task type. Track chunk utilization if the model is consistently ignoring the bottom half of retrieved context, you’re retrieving too much and wasting tokens on low-signal content. A drop in retrieval relevance scores almost always precedes a quality score decline by 24-48 hours. It’s the earliest warning signal you have.
Build a regression dataset from production failures.
Every time a quality failure is confirmed through user feedback, a low judge score that human review validates, or a flagged response log the input, the bad output, the root cause, and the expected output. Run this dataset before every significant change: prompt update, model upgrade, documentation index refresh. A change that fixes a new issue while reintroducing an old one isn’t a net improvement.
Quality alerts worth configuring:
Overall quality score dropping more than 10% over 48 hours for any task type
Groundedness score average falling below 3.5 the highest-risk dimension for this system
Retrieval mean relevance score dropping below 0.75 early signal of index staleness
Refusal rate exceeding 5% often indicates a retrieval coverage gap
Heuristic failure rate spiking after any documentation index update
Pillar 3: Latency & Reliability Observability
Internal tools have more latency tolerance than consumer products but not unlimited tolerance. Employees asking a quick policy question during a meeting expect a response in seconds. A system that’s intermittently slow gets abandoned for a Slack message to HR instead, which defeats the purpose entirely.
Instrument every pipeline stage separately.
End-to-end latency tells you something is slow. Stage-level latency tells you where. Track retrieval latency, embedding latency, context assembly time, LLM inference latency, and post-processing time independently tagged by task type. When end-to-end latency spikes, you want to know in seconds whether it’s a retrieval issue, a model issue, or a context assembly issue, not after an hour of log diving.
Track TTFT separately from end-to-end latency.
For streaming responses, time to first token is the latency signal that determines whether an employee thinks the system is working. A response that starts streaming in 400ms feels responsive even if it takes 8 seconds to complete. Track TTFT as a first-class metric, trend it over time, and alert on P95 breaches separately from end-to-end latency breaches. They degrade for different reasons and point to different parts of the pipeline.
Use P95 and P99, not averages.
A system with average end-to-end latency of 2 seconds might have P99 latency of 18 seconds. That means 1% of employees are waiting nearly 20 seconds often the ones asking the most complex questions, who need the system most. Set SLOs against P95 and P99 by task type. Alert when they breach, not when averages drift.
Surface retry and fallback rates explicitly.
Silent retries where the client library retries a failed LLM call automatically are one of the most common sources of unexpected latency spikes in production. A request that retried twice before succeeding looks identical to one that succeeded immediately in your end-to-end latency metrics. It’s not. Log every retry with its reason, every fallback to a secondary model, and every timeout. Track retry rate as an operational metric. A spike in retry rates is often the earliest signal of provider-side reliability problems earlier than error rates, earlier than latency percentiles.
Design fallback paths and test them.
Every external dependency needs an explicit answer to: what happens when this fails? If the vector database is unavailable, does the system fall back to answering from parametric knowledge with a caveat, or does it return an error? If the primary model times out, is there a configured secondary model that’s been tested, or is it theoretical? Fallback paths that haven’t been tested don’t work when you need them. Test under simulated failure conditions before a production incident forces you to find out.
Circuit breakers for every external dependency.
The vector database, the embedding service, the LLM provider each needs a circuit breaker that stops sending requests to a failing dependency and returns a fallback response immediately. Without circuit breakers, a retrieval service returning errors receives the full load of production traffic on every request, compounding failures downstream. Configure circuit breakers to open after a defined error rate threshold, stay open for a recovery window, and test recovery with a fraction of traffic before closing. Surface circuit breaker state prominently in your operational dashboard — it shouldn’t be buried in logs.
Latency alerts worth configuring:
TTFT P95 exceeding 2 seconds employees notice this immediately
Retrieval stage P99 exceeding 800ms early signal of vector database issues
End-to-end P95 exceeding 8 seconds by task type
Retry rate exceeding 5% over any 15-minute window
Circuit breaker opening on any dependency immediate alert, not a daily digest
Connecting the Three Pillars: The Dashboard View
Individual pillar instrumentation is useful. The real value comes from viewing all three together because the most interesting production problems involve interactions between pillars, not failures within a single one.
Four views every internal knowledge base system should have:
Request health overview -request volume by task type, cache hit rate by query category, error rate, fallback rate, and circuit breaker state for each dependency. The operational pulse of the system at a glance.
Cost trend -cost per successful task by task type over a 7-day window, token breakdown by pipeline stage, cache hit rate trend, and the top query patterns by cost. A declining cache hit rate here is often the first signal of query distribution shift before it shows up in cost.
Quality trend -overall quality score and groundedness score by task type over a 7-day window, retrieval mean relevance score trend, refusal rate, and heuristic failure rate. Groundedness is the canary for this system, watch it first.
Latency profile -P50/P95/P99 end-to-end latency by task type, TTFT P95 trend, stage-level latency breakdown, retry rate, and fallback rate trend.
The cross-pillar interactions worth watching:
A drop in retrieval relevance scores (quality view) often precedes a quality score decline (quality view) and a latency increase (latency view) as the model works harder to generate responses from weak context all three move together, but retrieval relevance moves first.
A cache hit rate drop (cost view) often correlates with cost increases (cost view) and latency increases (latency view) as more requests hit the full pipeline. If cache hit rate is dropping without an obvious change in query volume, it usually means query distribution has shifted worth investigating before it becomes a cost problem.
A retry rate spike (latency view) that precedes an error rate increase is almost always a provider reliability issue catch it at the retry rate signal, not the error rate signal.
The Deployment Checklist
Before this system goes live or before any significant change is deployed — these questions should be answerable from your observability layer:
Cost
Is cost per successful task stable across task types in staging?
Is cache hit rate at expected levels for high-frequency query categories?
Are context tokens within expected ranges by task type?
Quality
Has the regression dataset been run against the current build?
Are groundedness and accuracy scores above threshold on the regression set?
Has retrieval quality been validated after any documentation index changes?
Has the LLM judge been calibrated against human labels in the last 30 days?
Latency
Is TTFT P95 within SLO under expected concurrent load?
Have all external dependencies been load tested at peak concurrency?
Have fallback paths been tested under simulated failure conditions?
Are circuit breakers configured and verified for all dependencies?
Is retry logging active and surfaced in the operational dashboard?
If any of these questions can’t be answered before deployment, the deployment should wait.
The Underlying Principle
Observability for a production GenAI system isn’t three separate instrumentation projects. It’s one instrumentation project that surfaces signals across three dimensions -cost, quality, and latency connected by a common trace ID and viewed together in a coherent dashboard.
The internal knowledge base is a good model for why this matters. A documentation index refresh that degrades retrieval quality will show up first in retrieval relevance scores, then in groundedness scores as the model starts hallucinating to fill gaps, then in latency as users ask follow-up questions to get the answer they needed, then in cost as those follow-up turns compound. None of those signals make sense in isolation. Together they tell a clear story.
Build the instrumentation so the story is always visible. The rest of production operations follows from that.
The series: Observability → Token Economics → Evaluation → Latency & Reliability → Case Study → This post. The first four posts cover the principles. The case study connects them through a real failure scenario. This post shows what the full instrumentation picture looks like on a concrete system.